Vegetation water stress assessment from thermal images
Plant temperature-based water stress assessment is a direct and non-invasive method, which provides reliable and accurate results. Its main advantage relies on being a direct measure that allows us to know the water status for each plant, even in large areas.
How is the assessment of water stress carried out from plant temperature?
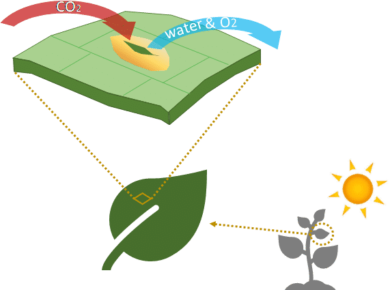
During plant transpiration, evaporation through stomata works as a stabilizer of leaf temperature during evapotranspiration. When the crop is under water stress, the stomata close, the transpiration decreases and the temperature increases.
On the other hand, the leaf temperature depends on the atmospheric conditions. Both the ambient temperature and the relative humidity of the air have a direct influence. If we analyze a specific crop, where the environmental conditions are homogeneous, the higher the temperature of the leaf, the higher the water stress level of the plant.
Which results can be obtained from thermal images?
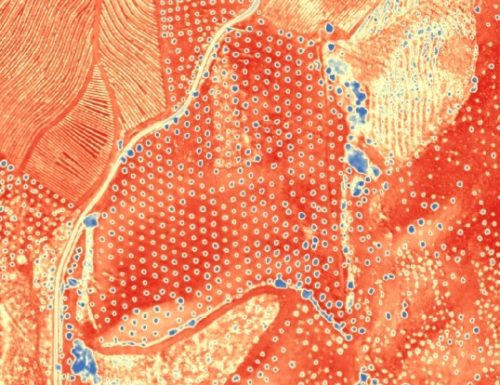
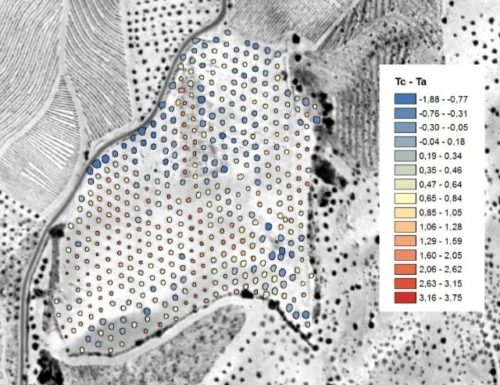
Based on thermal images, and applying a proper pure vegetation pixel segmentation, we can obtain the average temperature for each individual plant or tree crop. Calculating the difference between the crop temperature (Tc) and the air temperature (Ta) we make a first diagnosis about the spatial variability of the water stress in the plot.
In the following images, it can be observed the thermal mosaic of an olive grove (image on the left) and the result of the calculated Tc-Ta (image on the right) as an indicator of the variability of the water status of olive trees.
In this particular case, individual trees with a temperature lower than air temperature (Tc <Ta) are those that have a lower level of water stress. On the contrary, individuals with higher temperature than air temperature (Tc> Ta) have higher levels of water stress.
SPATIAL VARIABILITY CHARACTERIZATION
In some cases, this diagnosis about spatial variability is sufficient, for example if the objective is to assess the variability of water stress within a specific irrigation sector. Frequently the irrigation sectors are dimensioned considering indirect parameters related to soil properties, climatology, relief, etc.
However, the measurement of plant temperature is a direct parameter that informs about how a plant is taking advantage of the water availability and how it affects its physiology, independently of the characteristics of the soil on which it is developed.
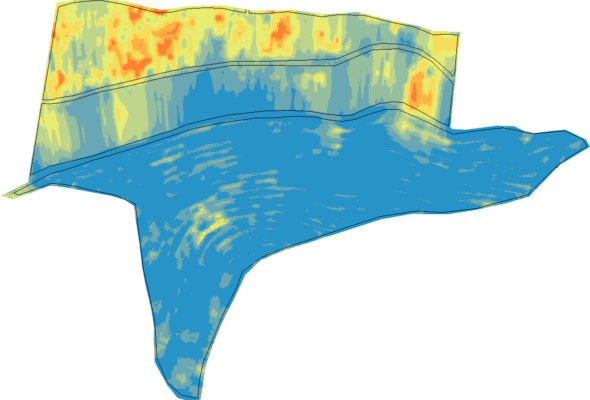
In the following example (vineyard), the differences between three contiguous irrigation sectors can be observed. From the thermal mosaic (left image) an image segmentation processing has been conducted, Tc-Ta has been calculated and the zoning has been established (right image)
It is observed that the sector located at the bottom shows lower water stress and, in addition, there is a high homogeneity within the sector. The sector located in the center shows more uniformity, with some areas more stressed, while the sector located in the upper area shows higher levels of stress and great variability.

WATER STRESS MONITORING
But if our objective goes further and we need a measure of the water stress level to enable irrigation decision making, we must then perform a more advanced analysis. To do this, we use the CWSI index (Crop Water Stress Index), which takes into account several factors:
- Atmospheric conditions (Air temperature and relative humidity)
- Crop temperature
- Baselines that determine the lower and upper limits of plant water stress level.
CWSI is a normalized index that provides values on a scale of 0 to 1. The values closest to 0 are related to a low level of water stress and values closer to 1 indicate a high level of water stress. From the point of view of irrigation management, CWSI allows to calculate the dose needed to bring the plant to the desired stress level in each phase during the development of the crop.
PLANT PHENOTYPING TRIALS
Moreover, the potential of CWSI is critical for the comparative analysis of resistance to water stress in a trial in which the plants are subjected to different irrigation doses.
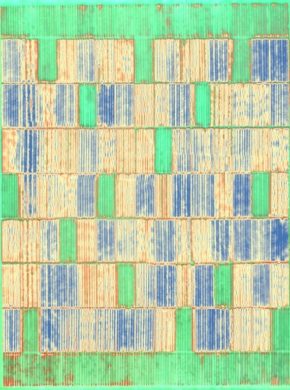
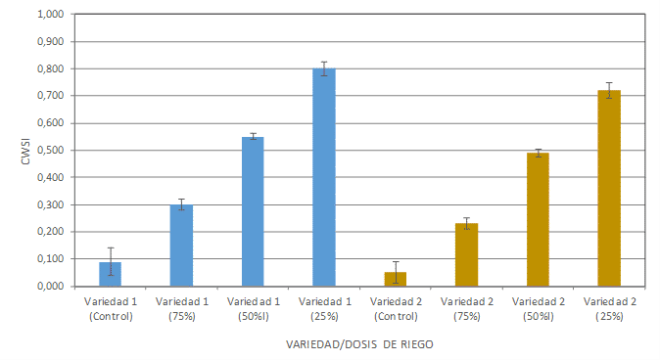
In the following example, it can be observed in the thermal mosaic the temperature differences that occur in a trial with two varieties of soybean under four different irrigation levels. It shows, on the one hand, a high correlation between the irrigation dose and the value of CWSI and, on the other hand, that the variety 2 presents lower levels of water stress compared to variety 1 for the same doses of irrigation.
Conclusions
The thermal analysis is a powerful tool for monitoring the water stress level of plants. The following main applications can be highlighted, among others:
- Analysis of the efficiency and variability in irrigation sectors.
- Decision making on irrigation doses based on direct data referring to the state of the plant, instead of indirect parameters (soil, climatology, etc.), for the efficient use of water in agriculture. Particularly interesting in the assessment of deficit irrigation practices, where it is necessary to control the water deficit levels.
Characterization of the resistance to water stress of different varieties in plant phenotyping trials.


